


The first page of the SumUp Dashboard WAS a bad first-time user experience. And it's one of the most visited pages. When having done the first transaction, the overview contained total sales revenue, transaction types, and a brief payout info–nothing personal. For our team, there was no prior research and very little data to base decisions on. We had to start from scratch.

User Research

We tested a first prototype with 50 Maze Panel users to validate a new direction. In the simplified Sign-up flow, 92% of users finished the predefined path. After the first-time experience flow, 37% said it was "Simple, nice, easy". 43% said there was "nothing to improve" and 20% had an issue. We were up to something, as the new approach was perceived as simple and friendly. In the Multi-Product Discovery, however, users got stuck in the carousel, sometimes repeating it for 4 times. We needed to fix this.

Then we combined a survey in 3 core markets with a round of explorative interviews to learn WHY, HOW, WHEN merchants use the dashboard. The findings: They login in the evening for the admin work, to view their sales and performance, and solve specific problems. Merchants welcomed the sales info on top—also framed as "snapshot of their business"—in order to see how they are doing. Basic figures are fair enough for that as merchants don't want to spend too much time. Have Reporting separate made sense to merchants in order to look at the business in more detail. While most merchants were open or neutral to see additional SumUp products and supportive tips, roughly 5% pushed back as they felt distracted.
Personalized Homescreen

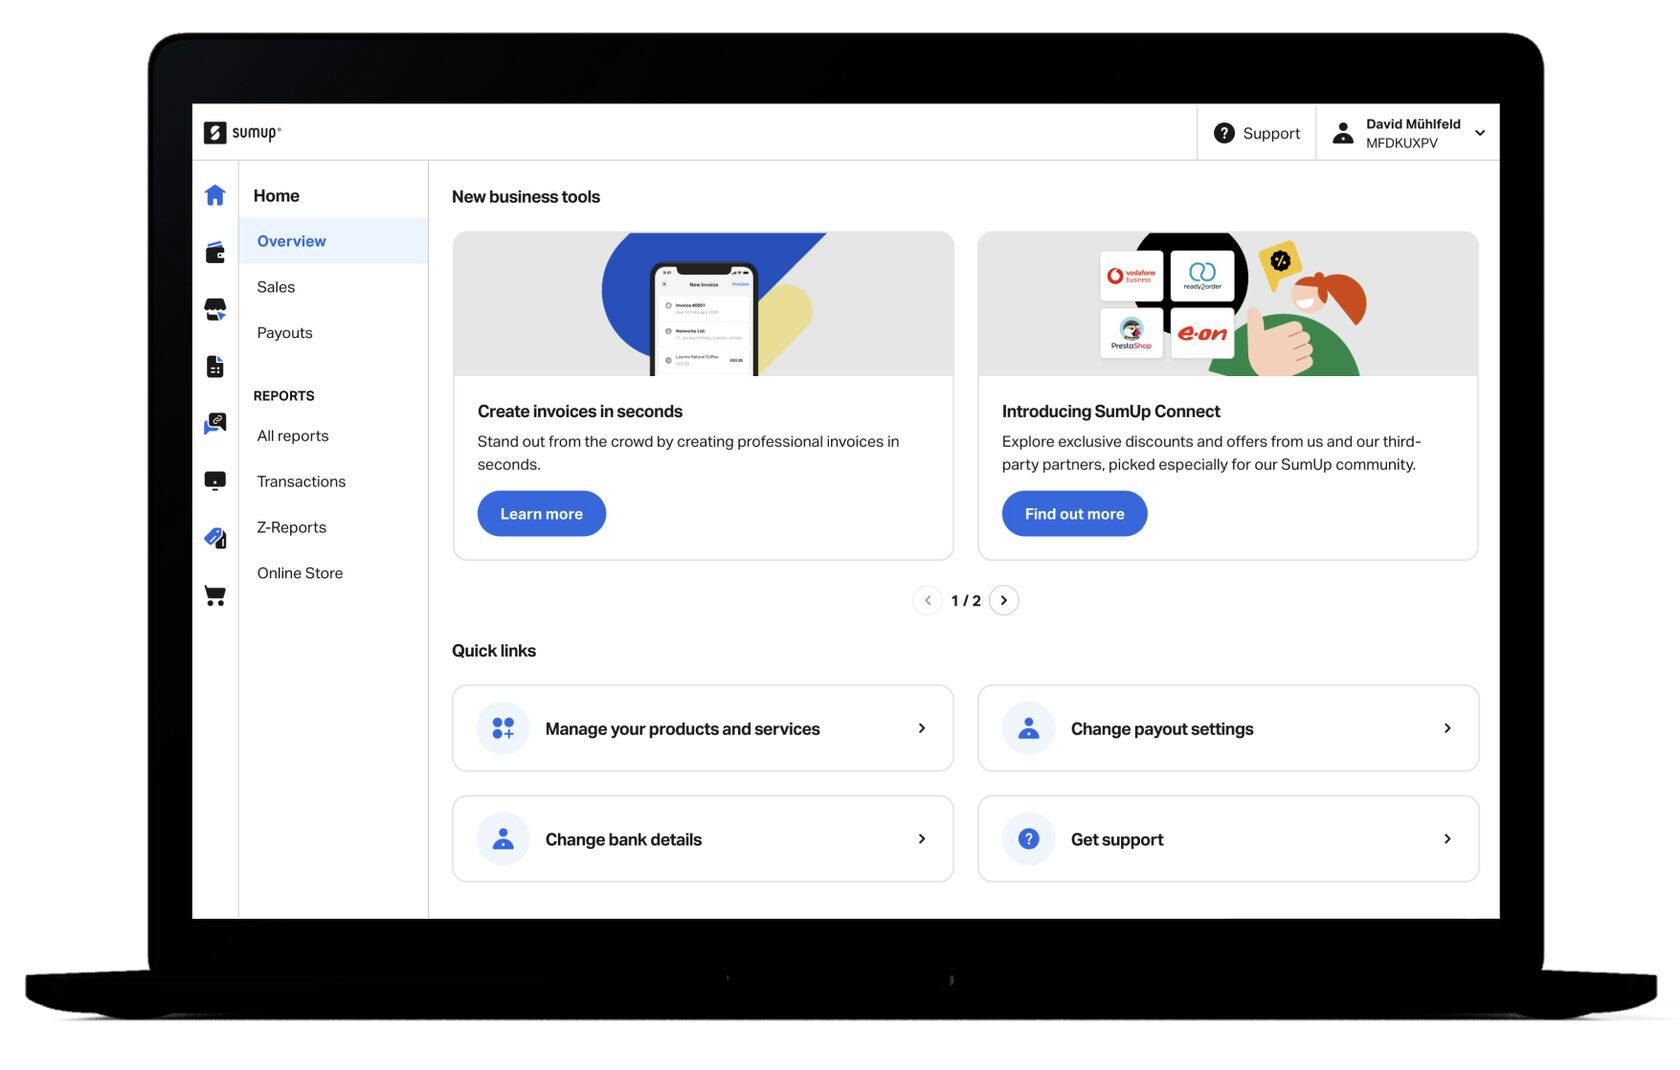
Originally, the homescreen was personalized for new users and transacting users. E.g. a new user could send Payment Links in the App, and review important settings such as payouts and changing the bank account. This is based on the most common support case reasons. Transacting users see a Reporting widget with the most important business data (which are based on user research!) and we highlight additional SumUp products as the merchant already got started. The screens above show already an iterated version from 2023, but the core ideas from 2020 are still in use.
Outcome

The click rates went through the roof once rolled out globally, leading to this awesome hockey stick graph. The teasers for first-time users were very successful: ~20% click rate and ~4% conversion based on logins. For transacting users, we saw a click rate of ~3% and a conversion of ~0.5% based on logins. Overall, the small links to payout settings and bank account settings performed surprisingly well in both segments. The clicks on reports were by far ahead, showing that this matters most to our merchants.